
In the ever-evolving world of cryptocurrencies, Ethereum stands out as one of the most dynamic assets. As of the time of writing, Ethereum’s price is $4,445.23, up 3.14% in the past 24 hours. This bullish movement has set against a backdrop of intense institutional interest and whale activity, catapulting the cryptocurrency’s market capitalisation to $536.6 billion.
With a trading volume hitting $25.6 billion in the same period, Ethereum showcases strong liquidity and investor interest. In this article, we’ll explore the recent developments, technical insights, and potential short-term trajectories that may shape Ethereum’s future, offering a comprehensive overview for both investors and enthusiasts alike.
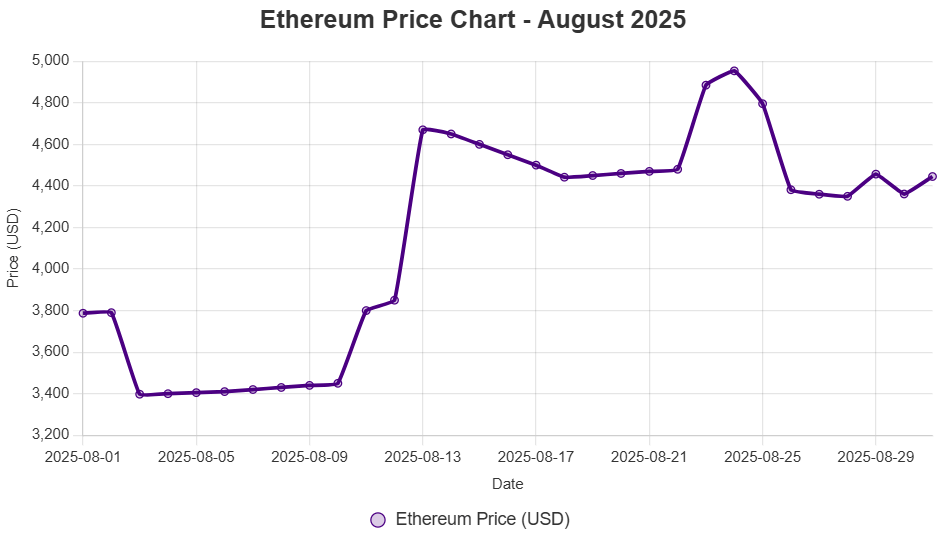
Recent Market and Price Performance
Ethereum has seen a remarkable recovery in recent weeks, driven by its essential role in supporting decentralised finance (DeFi) and non-fungible tokens (NFTs). The cryptocurrency’s price has continued to rise, buoyed by a blend of macroeconomic factors and ecosystem-specific developments. Over the course of this month, Ethereum has experienced periods of volatility, with prices fluctuating between $4,200 and $4,900. This range reflects the asset’s sensitivity to general market sentiment, including changes in interest rates and global economic indicators.
The daily gain of 3.14% marks a bullish momentum that has been gathering since early August. Analysts cite this as a result of renewed confidence in Ethereum’s scalability solutions and its leadership role in layer-2 technologies. Although there are occasional dips, the overall trend suggests that Ethereum has been performing well in terms of market share compared to other altcoins. This is no small amount, especially considering that it now boasts a market capitalisation of $536.6 billion, which accounts for a significant chunk of the total cryptocurrency market, thereby solidifying its position as the second-largest digital asset after Bitcoin.
There has also been a significant increase in trading volume, which totalled $25.6 billion over the last 24 hours. This increase in activity suggests that both retail and institutional traders are actively participating, which can be interpreted as a sign that a more sustained rally is underway. However, investors should remain cautious, as high volume can also increase price swings in both directions.
Latest News Events Shaping Ethereum’s Landscape
Ethereum’s recent performance is not happening in isolation; there are several key news items that have been pumping it. These include collaborations, technology enhancements, whale migration, ETF inflows and regulatory developments. In order to meet this objective, we summarise the most impactful stories below from the last month.
Partnerships and Ecosystem Expansions
Ethereum has continued to make strategic partnerships that will help improve its utility and adoption. In mid-August, a massive joint effort between Ethereum L2 solutions and top finance institutions was revealed. For example, collaborations with traditional banks have focused on integrating Ethereum’s blockchain for cross-border payments, aiming to streamline the process and reduce transaction costs.
One notable development involves a partnership with a leading European bank to experiment with Ethereum-based smart contracts for managing the supply chain. This action is likely to bring real-world applications to the foreground, potentially bringing enterprise users.
Additionally, decentralised applications (dApps) on Ethereum have witnessed enhanced collaborations with Web3 projects. One notable example is the integration of Ethereum with emerging AI platforms, where developers are leveraging the network’s robust infrastructure to develop AI-powered DeFi applications. These collaborations serve to both strengthen Ethereum’s ecosystem and add to its long-term value proposition by diversifying use cases beyond speculation.
Improvements to Networks and Technology
Ethereum’s continuous upgrades remain a driving force behind its popularity. Ethereum’s latest phase for sharding and enhanced PoS was successfully implemented in early August. This upgrade aims to improve transaction throughput, reduce gas fees, and make the network more user-friendly for daily users. Programmers have reported that the speed of processing has increased by 20%, which could reduce the longstanding congestion.
In addition, layer-2 solutions such as Optimism and Arbitrum have undergone updates that are becoming more compatible with Ethereum’s mainnet, ensuring smooth interoperability. These developments are pivotal as they alleviate scalability issues, positioning Ethereum as a suitable solution for accommodating the increasing demand from DeFi protocols and NFT marketplaces. Industry experts predict that these enhancements will result in a doubling of on-chain activity by the end of the year, further establishing Ethereum’s clear leadership in the smart contract sector.
Whale Passages and Mega-Gathering Areas
Whale activity has been especially active in August, as several high-profile transactions have grabbed market attention. A well-known Bitcoin whale with over $5 billion in assets moved $1 billion from Bitcoin to Ethereum, leaving speculators to question if we’re heading towards a more universal rotation into ETH. This manoeuvre, carried out over several days, added to a temporary price spike and showcased Ethereum’s perceived upside potential.
Other whale pools include 48 new addresses forming with balances over $46 million in ETH. These blockages, which amount to billions, indicate strong belief from key holders when markets are in a dip. Analysts consider this a bullish sign of accumulation during periods of weakness, with whales preparing for the expected bull run. However, such movements can also create volatility, with large sell-offs capable of putting pressure on prices lower should sentiment turn sour.
ETF Flows and Institutions Inflows
One of the most bullish Ethereum charts has been the record inflows into spot Ethereum exchange-traded funds (ETFs). August saw ETFs seeing $4 billion in net inflows (with a single day seeing $1 billion of that inflow). Overall, institutional ETH ETF assets now account for 5.3% of the circulating supply, with $27.7 billion in inflows since launch.
The bullishness of the market was heightened with major institutions scooping up the bottom of the trough during a mid-month correction. This institutional momentum has acted as a support for Ethereum’s price, buffering the impact of broader market corrections. The inflows represent an increase in the recognition of Ethereum as a legitimate asset class, on par with traditional commodities such as gold. As more ETFs are approved worldwide, this trend is likely to accelerate, bringing new capital into the ecosystem.
Changes in Regulations and Policy
Regulatory changes have also been an important cause. Early on in August, changes in U.S. policy have bolstered Ethereum’s position with clearer rules on staking and DeFi operations. The U.S. Securities and Exchange Commission (SEC) has deferred a decision on more ETF applications but hinted at a more welcoming attitude toward Ethereum-based securities.
Regulatory harmonisation: European regulators have taken steps to harmonise crypto regulations, which could facilitate Ethereum’s adoption in the region. These changes clear up uncertainty, leading to more institutional engagement. However, energy consumption and environmental impact continue to be sources of controversy and are likely to continue to be challenging concerns unless they are mitigated with further upgrades.
Technical Analysis: Support and Resistance Levels
Ethereum’s technical picture is mixed, but optimistic based on the charts. Based on the current indicators, the asset exhibits neutral signals from oscillators and moving averages, indicating a consolidation period rather than a strong directional bias.
Key support levels are marked around $4,200, which was the bottom for the pullbacks so far. This level correlates with historical liquidity zones and may serve as a solid foundation if selling pressure escalates. This comes from the support of $3,800, which is a secondary support, but tied to longer-term moving averages.
On the positive side, there is resistance between $4,800 and $5,000, an area with significant liquidity and a history of previous rejections. A breakout here could aim for $4,900, the site of a recent high where long positions were liquidated. Indicators like RSI are bouncing around 55, which suggests upward movement is possible but not overbought.
Overall, the chart indicates that Ethereum is set to break out, subject to continuation in terms of volume, and positive news flow.
Short-Term Bullish and Bearish Indicators
If you’re wondering what Ethereum’s short-term future holds, it’s essential to consider several key factors. Possible bullish and bearish scenarios are:
Bullish Scenario
- Catalysts: September saw ETFs receive over $5 billion in net additions, and the successful execution of recent upgrades may spur a positive price move. If whale clustering persists and regulatory certainty continues to increase, Ethereum could reach $5,000 within the next two weeks.
- Price Targets: First $4,800, then $5,200 if momentum is maintained. This would be multiplied by DeFi activity and NFT volumes, potentially yielding a 15-20% reward.
- Confirmations: If the trend is verified by a golden cross on moving averages and RSI above 60, it would attract more buyers.
Bearish Scenario
- Catalysts: Ethereum’s prospects for downward pressure could arise from broader market risks, including Bitcoin correction or regulatory setbacks. This could be made worse by whales profit-taking or by a slow down in demand from ETFs.
- Price Targets: A pullback below the $4,200 level could challenge the $3,800 level, representing a 10-15% retracement. This could be triggered by an increase in volatility following global economic data releases.
- Indicators: Lower moving averages and an RSI dip below 40 (or a death cross) would indicate weakness, which would allow sellers to take control.
In any case, investors should pay close attention to volume and sentiment, as Ethereum’s interdependence with the cryptocurrency market magnifies the impact of exogenous drivers.
Conclusion
Ethereum’s recent bullish trend, driven by institutional adoption, technological advancements, and strategic whale activity, establishes it as a leader in the cryptocurrency ecosystem. Despite the challenges, the asset’s fundamentals seem strong, and there’s room for further gains if trends continue to unfold favourably. As always, smart risk management is paramount due to the market’s inherent volatility.
| Metric | Value |
|---|---|
| Current Price | $4,445.23 |
| 24h % Change | 3.14% |
| 24h Volume | $25.6B |
| Circulating Supply | 120.7M ETH |
| Total Supply | 120.7M ETH |
 Bitcoin
  Ethereum
  Tether
  BNB
BNB  XRP
XRP  USDC
USDC  Solana
  Cardano
  Avalanche
  Toncoin