

A cryptocurrency whale has made waves in the Bitcoin market by opening a staggering $1 billion short position with 40x leverage on Hyperliquid, a decentralized derivatives exchange. This bold move, reported by blockchain analytics platforms, signals a bearish outlook from a major player and has sparked intense speculation about Bitcoin’s near-term price action. Here’s a deep dive into the details, market context, and potential implications of this high-stakes trade.
What Happened: The $1 Billion Bitcoin Short
On-chain data from platforms like Look on chain and Alphractal revealed that a prominent Bitcoin whale, identified as Qwatio, deposited $2.3 million in USDC to Hyperliquid and opened a 40x leveraged short position on 826 BTC, valued at approximately $1 billion. The trade, executed around May 21, 2025, when Bitcoin was trading near $105,000, positions the whale to profit if Bitcoin’s price declines significantly. However, the high leverage means even a modest price increase could lead to substantial losses or liquidation.
The whale’s liquidation price is estimated at $106,600, meaning a Bitcoin price surge above this level could wipe out the position. As of May 25, 2025, Bitcoin is trading at $104,885, down 0.45% in the last 24 hours, placing the trade in a precarious position.
Who Is the Whale?
The identity of the whale remains pseudonymous, but their wallet activity suggests they are a sophisticated trader or institutional player with a history of large-scale trades. Unlike James Wynn, a well-known trader recently associated with massive long positions on Bitcoin (including a $1.25 billion long bet), this whale’s bearish stance contrasts with the broader bullish sentiment in the market.
Blockchain trackers note that the whale’s previous trades have influenced short-term market volatility, with some speculating that their moves are closely watched by market makers hunting for liquidations. Posts on X indicate that market makers may be “chasing” this short, potentially triggering a short squeeze if Bitcoin’s price climbs.
Why This Matters: Market Context and Sentiment
- High Leverage Amplifies Risk and Reward
A 40x leverage means the whale is controlling a $1 billion position with just $25 million in margin. While this amplifies potential profits if Bitcoin’s price drops, it also magnifies losses. A 2.5% price increase could lead to a margin call or liquidation, making this a high-risk gamble.
- Contrasting Market Trends
The whale’s bearish bet stands out against a backdrop of Bitcoin accumulation by other whales and institutions. For instance:
- Bitcoin whales have accumulated over 43,100 BTC ($4 billion) in the past two weeks, signaling long-term confidence.
- Spot Bitcoin ETFs have seen $40 billion in inflows, reflecting strong retail and institutional demand.
- Bitcoin recently broke $100,000, with some analysts predicting a push toward $115,000 if momentum continues.
This short position suggests the whale anticipates a near-term correction, possibly driven by profit-taking or macroeconomic factors like U.S.-China trade tensions.
- Potential for a Short Squeeze
X posts highlight speculation that market makers are targeting the whale’s liquidation price of $106,593. A short squeeze, where rising prices force short sellers to buy back Bitcoin to cover their positions, could fuel a rapid price spike. This dynamic has traders on edge, with some predicting a new all-time high for Bitcoin if the squeeze materializes.
Broader Implications for Bitcoin and Crypto Markets
- Volatility on the Horizon
The sheer size of this short position could amplify Bitcoin’s price volatility. If the whale’s bet pays off, a wave of selling pressure could push Bitcoin below key support levels like $95,000, triggering further liquidations. Conversely, a failure to break lower could spark a rally, especially if market makers hunt the liquidation price.
- Decentralized Finance (DeFi) in the Spotlight
The use of Hyperliquid, a DeFi platform, underscores the growing role of decentralized exchanges in hosting large-scale trades. Unlike centralized exchanges like Binance or Kraken, Hyperliquid offers transparency through on-chain data, allowing analysts to track whale activity in real-time. This trade highlights DeFi’s appeal to institutional players willing to take big risks outside traditional systems.
- Whale Influence on Market Sentiment
Whales like Qwatio wield significant influence, as their trades often set trends for retail traders. The bearish signal from this short could dampen sentiment, but the contrasting bullish moves by other whales (e.g., James Wynn’s $1.25 billion long) suggest a divided market. Traders are closely monitoring wallet activity for clues on the whale’s next move.
What’s Next for Bitcoin?
Bitcoin’s price action in the coming days will be critical. Key levels to watch include:
- Support: $95,000–$100,000, where Glassnode data shows significant whale accumulation.
- Resistance: $106,600 (the whale’s liquidation price) and $112,000 (recent highs).
Analysts are divided. Some see the whale’s short as a contrarian signal, predicting a correction after Bitcoin’s rapid rise above $100,000. Others argue that institutional buying and ETF inflows will overpower bearish bets, driving Bitcoin to new highs. The outcome hinges on whether the whale’s prediction of a downturn materializes or if market makers trigger a squeeze.
Conclusion: A High-Stakes Game in Crypto
The $1 billion short position by a Bitcoin whale on Hyperliquid is a bold play that has captured the crypto community’s attention. With 40x leverage, the trade embodies the high-risk, high-reward nature of crypto markets. Whether this whale’s bearish bet pays off or backfires, it’s a reminder of the outsized influence of large players and the volatility inherent in Bitcoin trading.
Traders and investors should stay vigilant, monitoring on-chain data and price levels for signs of a breakout or breakdown. As Bitcoin navigates this pivotal moment, one thing is clear: the crypto market remains a battleground for whales, market makers, and retail traders alike.
Introduction to Bitcoin’s Current Market Dynamics
As a professional crypto trader with years of experience navigating the volatile cryptocurrency markets, I’ve learned to rely on a combination of technical analysis, on-chain metrics, and market sentiment to anticipate price movements. Bitcoin (BTC), the flagship cryptocurrency, has been a focal point of global financial markets in 2025, with its price hovering around $102,000 as of May 25, 2025. However, recent technical signals and market developments suggest that Bitcoin may be poised for a bearish trend in the upcoming days. In this comprehensive analysis, I’ll break down the key indicators pointing to a potential pullback, explore the macroeconomic factors at play, and provide actionable insights for traders and investors.
Bitcoin’s price action in recent weeks has been characterized by a strong bullish run, with BTC climbing from a cycle low of $74,508 in early April to above $100,000 by mid-May. This rally, driven by institutional inflows, positive regulatory developments, and global liquidity trends, has fueled optimism across the crypto ecosystem. However, subtle cracks in the bullish narrative are beginning to emerge, with technical indicators flashing bearish signals and market sentiment showing signs of caution. Let’s dive into the data and unpack what’s driving this potential shift.
Technical Analysis: Bearish Signals on the Horizon
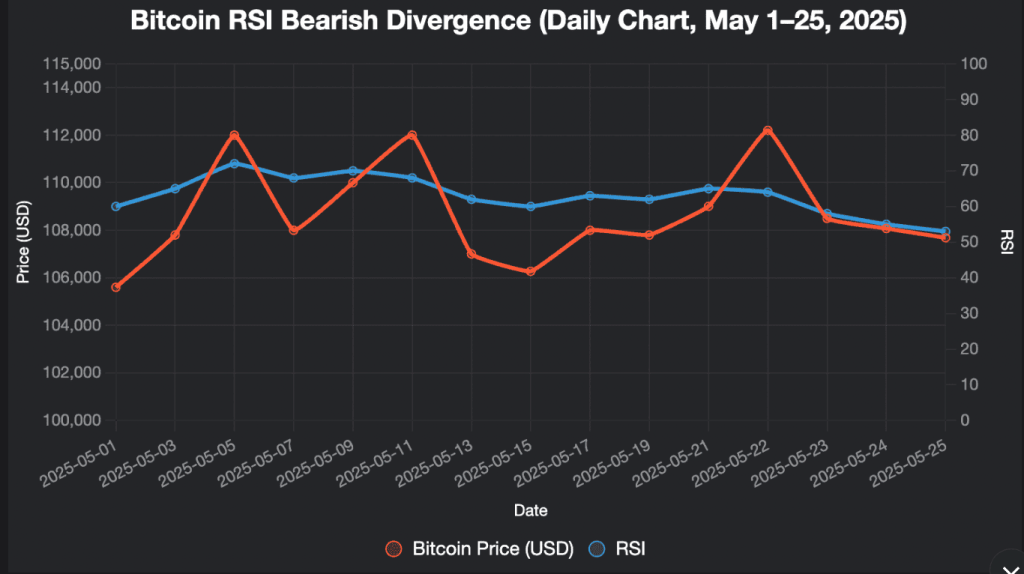
Bearish Divergence on RSI
One of the most compelling signals of a potential bearish trend is the bearish divergence observed on Bitcoin’s Relative Strength Index (RSI). On May 19, 2025, Bitcoin reached a local high above $107,000, but the RSI on the daily and three-day charts printed a lower high, indicating weakening momentum despite the price increase. This classic bearish divergence often precedes a trend reversal, as it suggests that buyers are losing steam. The subsequent 4.5% intraday decline to around $102,000 confirmed this signal, raising the risk of a deeper pullback below the critical $100,000 support level.
Failure to Break Key Resistance
Bitcoin’s inability to close above the $107,000 neckline level, a zone that triggered bearish reversals in December 2024 and January 2025, further supports the bearish thesis. This resistance level has acted as a formidable barrier, and the recent rejection suggests that sellers are defending this zone aggressively. If Bitcoin fails to reclaim this level in the coming days, it could signal a breakdown toward the $97,000–$98,500 support range, as highlighted by analysts.
Bearish Chart Patterns
On the daily timeframe, some analysts have identified the formation of a bearish M chart pattern, which could indicate a potential top in Bitcoin’s price action. This pattern, combined with a possible bearish pennant, suggests a 30% chance of a pullback to $100,500 and a 15% probability of a deeper flush to $95,800. While these patterns are not definitive, they align with other technical signals and warrant close monitoring.
Declining Market Buy Volume
On-chain data from platforms like TradingView indicates that Binance market buy volume is trending downward, a contrast to previous bull cycles where rising buy volume fueled sustained rallies. This decline suggests that buying pressure is waning, which could exacerbate a bearish move if selling pressure intensifies. Despite a steady upward trend in market buy volume since 2023, the current lack of aggressive buying signals caution for the short term.
TD Sequential Sell Signal
Posts on X have highlighted a TD Sequential sell signal on Bitcoin’s 12-hour chart, a technical indicator that often precedes short-term pullbacks. While not a definitive predictor, this signal aligns with the broader bearish divergence and resistance rejection, adding weight to the case for a near-term correction.
On-Chain Metrics: Mixed Signals
Slowing Spot Demand
According to CryptoQuant, Bitcoin’s spot demand has been contracting, with apparent demand declining by 146,000 BTC in the last 30 days. While this is an improvement from the 311,000 BTC plunge recorded on March 27, it indicates that demand momentum remains weak. For Bitcoin to sustain a bullish rally, spot demand, institutional ETF inflows, and stablecoin market cap growth (e.g., Tether’s USDT) need to accelerate. The current USDT market cap growth of $2.9 billion over the past 60 days is insufficient to support the liquidity needed for a sustained rally, further supporting the bearish outlook.
Options Market Sentiment
Glassnode’s analysis of Bitcoin’s options market reveals a rise in bullish sentiment, with the 1-month 25 Delta Skew dropping to -6.1%, indicating higher implied volatility for call options compared to put options. While this suggests that some traders are betting on further upside, it also highlights a potential overcrowding of bullish positions, which could lead to liquidations if the price reverses. The liquidation of nearly $400 million in bearish short positions during Bitcoin’s recent rally to $104,000 indicates significant leverage in the market, increasing the risk of volatility.
Institutional Activity
Despite the bearish signals, institutional confidence remains a wildcard. Spot Bitcoin ETF inflows have been positive over the past seven days, reflecting persistent interest from institutional investors. However, a sudden drop below $102,400 on May 12, without a clear macroeconomic catalyst, suggests that institutional buying may not be sufficient to counteract selling pressure in the short term.
Macroeconomic Factors Influencing Bitcoin’s Price
U.S. Fiscal Concerns
Bitcoin’s recent price action has been influenced by broader macroeconomic developments. On May 19, Moody’s downgraded the U.S. government’s credit rating due to a rising budget deficit and the lack of a credible fiscal consolidation plan. This downgrade prompted downside moves across risk assets, including a 4.5% drop in Bitcoin’s price. As a risk-on asset, Bitcoin is sensitive to shifts in macroeconomic sentiment, and further deterioration in U.S. fiscal health could amplify bearish pressure.
U.S.-China Trade Talks
Optimistic signals from U.S.-China trade talks have boosted equity markets, with Dow futures climbing 1.3% and S&P 500 futures gaining 1.4%. However, Bitcoin and other cryptocurrencies experienced declines, with BTC slipping 0.6% to $103,900 on May 12. This divergence suggests that crypto markets are reacting cautiously to geopolitical developments, potentially due to liquidations and ETF outflows. A joint statement from the White House, expected to provide more details on the talks, could introduce additional volatility in the coming days.
Global Liquidity Trends
Bitcoin’s price has historically correlated with global liquidity, particularly the M2 money supply. While increasing global M2 has driven dramatic price surges in the past, current liquidity growth is not robust enough to support a sustained rally. This lack of liquidity, combined with macroeconomic uncertainty, reinforces the bearish outlook for the near term.
Market Sentiment: A Shift Toward Caution
Fear & Greed Index
The Fear & Greed Index, a popular measure of market sentiment, currently stands at 66 (Greed), reflecting optimism among investors. However, this level of greed can precede corrections, as overly bullish sentiment often leads to complacency. Over the last 30 days, Bitcoin has had 17/30 (57%) green days, with 5.21% price volatility, indicating a relatively stable but potentially overstretched market.
X Platform Sentiment
Posts on X reveal a mixed sentiment among crypto traders. While some analysts, like @martypartymusic, project a 55% probability of Bitcoin returning to support at $104,000 and continuing higher, others, such as @misterrcrypto and @CryptoMichNL, highlight bearish divergences and a potential blow-off top. The breakdown of Bitcoin dominance below its rising wedge support, as noted by @LordOfAlts, suggests that altcoins may outperform Bitcoin in the near term, further diluting BTC’s bullish momentum.
Peter Schiff’s Bearish Outlook
Economist Peter Schiff has warned of “fireworks” during Bitcoin’s next bearish dip, predicting unrealized losses for MicroStrategy’s BTC holdings. With MicroStrategy’s average purchase price at $69,287 per coin, a significant pullback could pressure leveraged positions and exacerbate selling pressure. While Schiff’s bearish stance is controversial, it reflects a growing caution among some market commentators.
Potential Price Targets and Scenarios
Based on the technical and fundamental factors outlined above, here are the potential price scenarios for Bitcoin in the upcoming days:
- Bearish Scenario (Base Case): If Bitcoin fails to reclaim $104,000 and breaks below the $100,000 support level, it could target $97,000–$98,500, aligning with the 50-day moving average and historical support zones. A deeper correction to $95,800 is possible if bearish momentum accelerates. Probability: 60%.
- Neutral Scenario: Bitcoin consolidates between $100,000 and $104,000, forming a range-bound pattern before a breakout. This scenario would require a stabilization of selling pressure and renewed buying interest. Probability: 30%.
- Bullish Scenario: Bitcoin reclaims $107,000 and pushes toward $125,400, as projected by some analysts. This would require a significant catalyst, such as positive regulatory news or a surge in ETF inflows. Probability: 10%.
Trading Strategies for a Bearish Trend
For traders looking to navigate a potential bearish trend, here are some actionable strategies:
Short-Term Trading
- Shorting Opportunities: Consider shorting Bitcoin on a confirmed breakdown below $100,000, targeting $97,000 or lower. Use tight stop-losses above $102,000 to manage risk.
- Scalping: Take advantage of intraday volatility by scalping around key support and resistance levels, such as $100,000 and $104,000.
- Hedging: Use put options or inverse ETFs to hedge long positions, protecting against downside risk.
Long-Term Investing
- Accumulation Zones: If Bitcoin drops to $95,000–$98,000, consider accumulating for the long term, as these levels have historically acted as strong support.
- Dollar-Cost Averaging (DCA): Continue DCA into Bitcoin to mitigate the impact of short-term volatility, focusing on long-term growth potential.
- Diversification: Allocate a portion of the portfolio to altcoins, which may outperform Bitcoin if BTC dominance continues to decline.
Risk Management
- Stop-Losses: Set stop-losses to limit losses in case of unexpected price movements.
- Position Sizing: Avoid over-leveraging, as high volatility could lead to significant liquidations.
- Stay Informed: Monitor macroeconomic developments, such as U.S.-China trade talks and Federal Reserve announcements, which could impact Bitcoin’s price.
Broader Implications for the Crypto Market
A bearish trend in Bitcoin could have ripple effects across the cryptocurrency market. Altcoins, which have shown resilience in recent weeks, may continue to outperform Bitcoin if BTC dominance declines further. Ethereum, Solana, and XRP have posted gains, with Ethereum crossing $2,400 and Solana surging 20%. The potential for an “altcoin season” is growing, driven by technical breakouts and positive developments like Solana’s Pump.fun platform.
However, a significant Bitcoin pullback could also dampen overall market sentiment, leading to liquidations and ETF outflows. The DeFi ecosystem on Bitcoin, already showing mixed signals with declining usage, could face additional pressure if market confidence wanes.
Conclusion: Preparing for Volatility
As a professional crypto trader, I view the current bearish signals as a natural part of Bitcoin’s market cycle. While the long-term outlook remains bullish, driven by institutional adoption and global liquidity trends, the short-term picture suggests caution. Technical indicators like bearish divergence, resistance rejections, and declining buy volume, combined with macroeconomic uncertainties, point to a potential pullback in the upcoming days. Traders should remain vigilant, employing robust risk management and strategic positioning to navigate this volatility.
By staying informed and adapting to changing market conditions, we can turn challenges into opportunities. Whether you’re a day trader looking to capitalize on short-term moves or a long-term investor building a diversified portfolio, understanding Bitcoin’s current dynamics is crucial. Keep an eye on key support levels, monitor macroeconomic developments, and be prepared for a potential shift in market sentiment.


 Bitcoin
  Ethereum
  Tether
  BNB
BNB  USDC
USDC  XRP
XRP  Solana
  TRON
TRON  Cardano
  Avalanche