
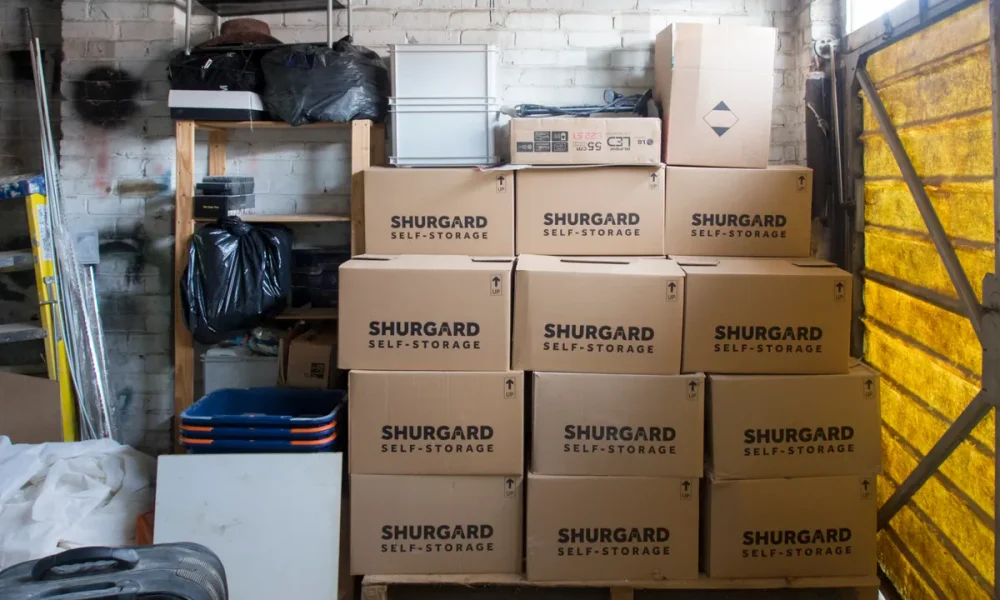
Safestore Holdings (LSE: SAFE) has built a case around 16 consecutive years of dividend growth, a 5.1% yield and a forward price-to-earnings ratio of 13.5, but the more interesting argument sits in the pipeline rather than the history. The UK’s largest self-storage operator appears to be approaching an earnings inflexion that the current price does not fully reflect.
Half-year numbers show the recovery is real
Safestore’s half-year results showed revenue climbing 6.9% to £120.6m, with underlying pre-tax profits up 2.3% to £44.6m. Strip out currency moves and the picture is slightly softer: the H1 2026 interim results show revenue growth of 5.6% at constant exchange rates, with underlying EBITDAR of £67.9m and adjusted diluted EPRA EPS rising 2.1% to 19.4p.
Those are not barnstorming numbers. What they are is confirmation that the contraction phase is over. For the full year ended 31 October 2025, group revenue came in at £234.3m, up 4.9%, with like-for-like revenue growth of 3.1%. Underlying EBITDAR reached £137.0m, though underlying profit before tax slipped 4.2% to £92.9m as net finance costs remained elevated at £26.4m.
The balance sheet is manageable. The FY2025 final results on the London Stock Exchange show net assets of £2,288.4m. The loan-to-value ratio stood at 28.1% at the FY2025 year-end; the snippet’s figure of 29.1% relates to the H1 2026 interim period, reflecting the £105m of new borrowings drawn during FY2025 that pushed net debt to approximately £1.1bn. Either way, the group is not overleveraged by sector standards.
The Safestore dividend growth case rests on a pipeline, not history
Safestore’s expansion model works on a deliberate delay. New stores open at below-market rental rates to build occupancy quickly, then rates step up over roughly two years. The stores opened in 2024 are now entering that accretive phase; those built in 2025 will follow next year. During H1 2026 alone, the group opened four new stores adding 192,000 sq ft, bringing total managed lettable area to 9.47m sq ft, up 2.0%.
The remaining development pipeline covers a further 20 stores and 1.1m sq ft, at an estimated total cost of £212m with £96m already committed. Management’s guidance for incremental EBITDA from these non-like-for-like and pipeline stores on stabilisation is £35m to £40m per year. That figure, drawn from Safestore’s own corporate results documents, supersedes an earlier estimate of £30m–£35m that has circulated in some commentary. The company sets a minimum development hurdle rate of 10%.
The programme is expected to be dilutive through FY2025 and FY2026 before becoming accretive. That timing is precisely why the valuation looks undemanding: the market is pricing the drag, not the payoff.
Where the thesis could stall
Occupancy has begun to recover but remains below the pre-inflation levels of 2021. Interest rates are the central variable: the FY2025 earnings call confirmed that adjusted diluted EPS for the year came in at 40.3p, with net finance costs still a meaningful drag. If rates stay higher for longer, the ramp-up in store economics takes longer to show up in earnings, and the £35m–£40m incremental EBITDA target slides further out on the timeline.
The FY2024 results provide useful context on how quickly the picture can shift: revenue that year was £223.4m, down 0.3% on a reported basis but up 0.2% at constant exchange rates, with LTV at 25.1% and 57% of debt fixed-rate. The broader earnings history on Quartr shows how dependent returns have been on the interest-rate environment. European expansion adds a currency dimension that constant-exchange-rate reporting partially masks but does not eliminate.
The full-year dividend of 30.70p per share for FY2025, sustained through the down cycle, underlines management’s confidence in cash generation. Sixteen years of unbroken dividend increases is a credible signal on its own. The next test is whether the store pipeline delivers its stabilised EBITDA on schedule, and whether rate cuts come fast enough to lift occupancy before the development cost base grows further.



 Bitcoin
  Ethereum
  Tether
  BNB
BNB  USDC
USDC  XRP
XRP  Solana
  TRON
TRON  Lido Staked Ether
  Cardano
  Gram (prev. Toncoin)
  Avalanche