Bitcoin
 Ethereum
 Tether
 BNB
 USDC
 XRP
 Solana
 TRON
 Lido Staked Ether
 Cardano
 Gram (prev. Toncoin)
 Avalanche
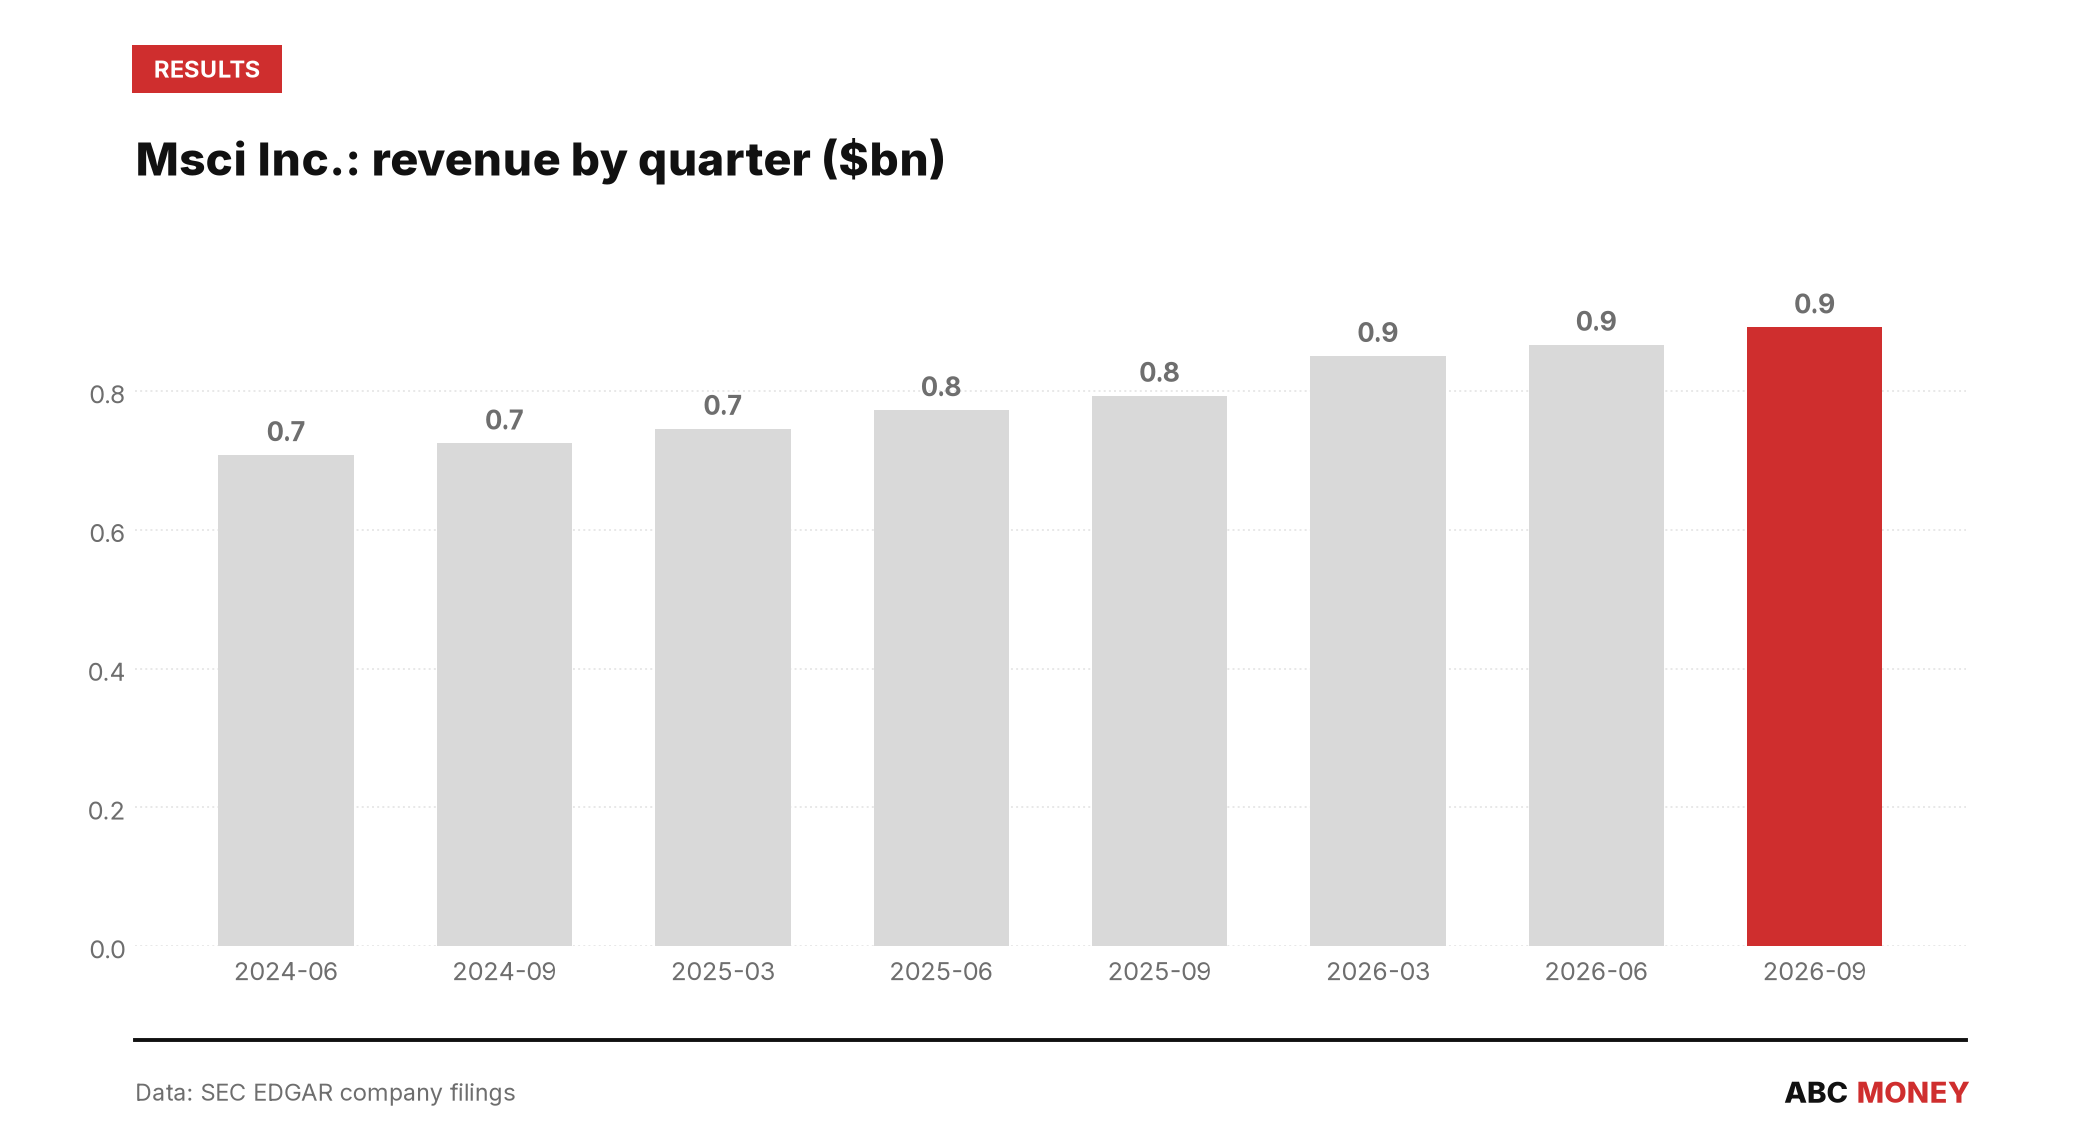
MSCI Q3 2026 earnings landed exactly where the index-and-analytics giant has trained investors to expect them: comfortably ahead of forecasts. MSCI Inc (NYSE: MSCI) told investors on its third-quarter earnings call on 20 October 2026 that revenue rose 12.4% year-on-year to $892.0m, asset-based fees – the slice of revenue tied to the value of ETFs and funds tracking MSCI indices – grew roughly 25%, and adjusted earnings per share climbed 14%. The company also disclosed $627.2m of share buybacks since the start of July, one of its larger repurchase pushes in recent memory.
The numbers check out against MSCI’s own filings almost to the decimal. The $892m revenue figure and 12.4% growth rate match the third-quarter 10-Q filed the same day, while asset-based fees growth of 24.9% rounds neatly to the “25%” management cited on the call. Where the story gets more interesting is in the gap between the headline growth rate and what actually reached shareholders’ pockets – and in how MSCI framed two acquisitions that didn’t both happen in the quarter being reported.
Index arm does the heavy lifting
The Index segment, MSCI’s largest and highest-margin business, had what the company called its best-ever third quarter for recurring net new sales, with segment revenue up 18.1% year-on-year, according to data compiled by 247wallst.com. That segment’s fortunes are closely tied to the asset-based fee line, which moves with the size of the ETF and fund pools benchmarked to MSCI indices rather than with new client wins alone – a reminder that a chunk of this quarter’s growth came from markets doing the work rather than MSCI’s sales team. Private Capital Solutions and Analytics also posted what management described as historic net new sales, even as the Sustainability and Climate unit lagged.
Revenue has now compounded steadily through MSCI’s last eight quarterly reports, from $707.9m in the second quarter of 2024 to $892.0m today – a run 247wallst.com notes extends to an eighth consecutive quarter of adjusted earnings beats.
The adjusted-EPS gap worth watching
MSCI’s transcript cited 14% EPS growth, and that figure is technically correct – but only for adjusted earnings per share, which strips out items like acquisition-related amortisation. Adjusted EPS came in at $5.11, up 14.3% on the year. The GAAP figure that actually reconciles to net income – diluted earnings per share – was $4.86, up a fractionally higher 14.4%, built on net income of $351.0m versus $325.4m a year earlier, a 7.9% rise that is a good deal more modest than the double-digit per-share growth figures suggest. The difference between net income growth and EPS growth is explained mostly by the buyback programme shrinking the share count, not by some hidden leap in profitability.
Adjusted EPS of $5.11 beat the Street consensus of $5.02 by about 1.8%, while revenue beat the $887.8m consensus by a slimmer 0.5%, according to Investing.com. Neither beat was large by MSCI’s recent standards, which makes the scale of the share-price reaction worth noting on its own terms.
Two acquisitions, one quarter of credit
MSCI’s call highlighted two deals as evidence of its climate and private-markets push: First Street and Vantager. Only one of them actually closed in the quarter being reported. First Street Technology, a physical climate-risk data specialist covering more than 2.4 billion structures worldwide according to MSCI’s own investor relations materials, was agreed in June and completed on 3 August 2026 for $122.6m net of cash acquired – a genuine third-quarter event, folded into the Sustainability and Climate segment. Vantager, which strengthens the Private Asset Diligence Platform, closed on 27 February 2026 – firmly a first-quarter transaction, even though it featured in the same breath on the Q3 call as part of a continuous acquisition narrative. Both are legitimate strategic moves; only one belongs to the quarter MSCI was actually reporting on.
Buybacks against a steepening yield curve
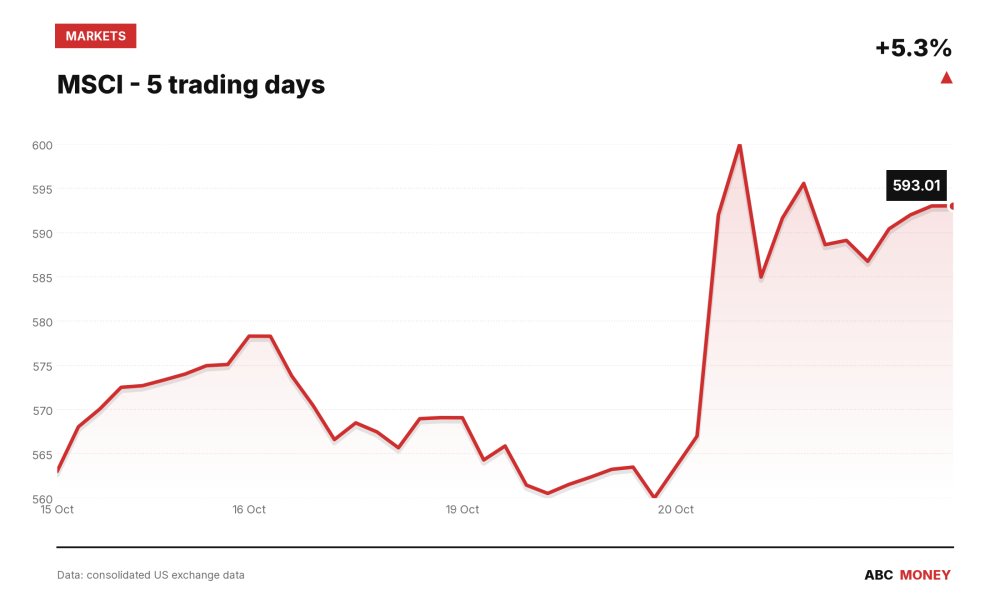
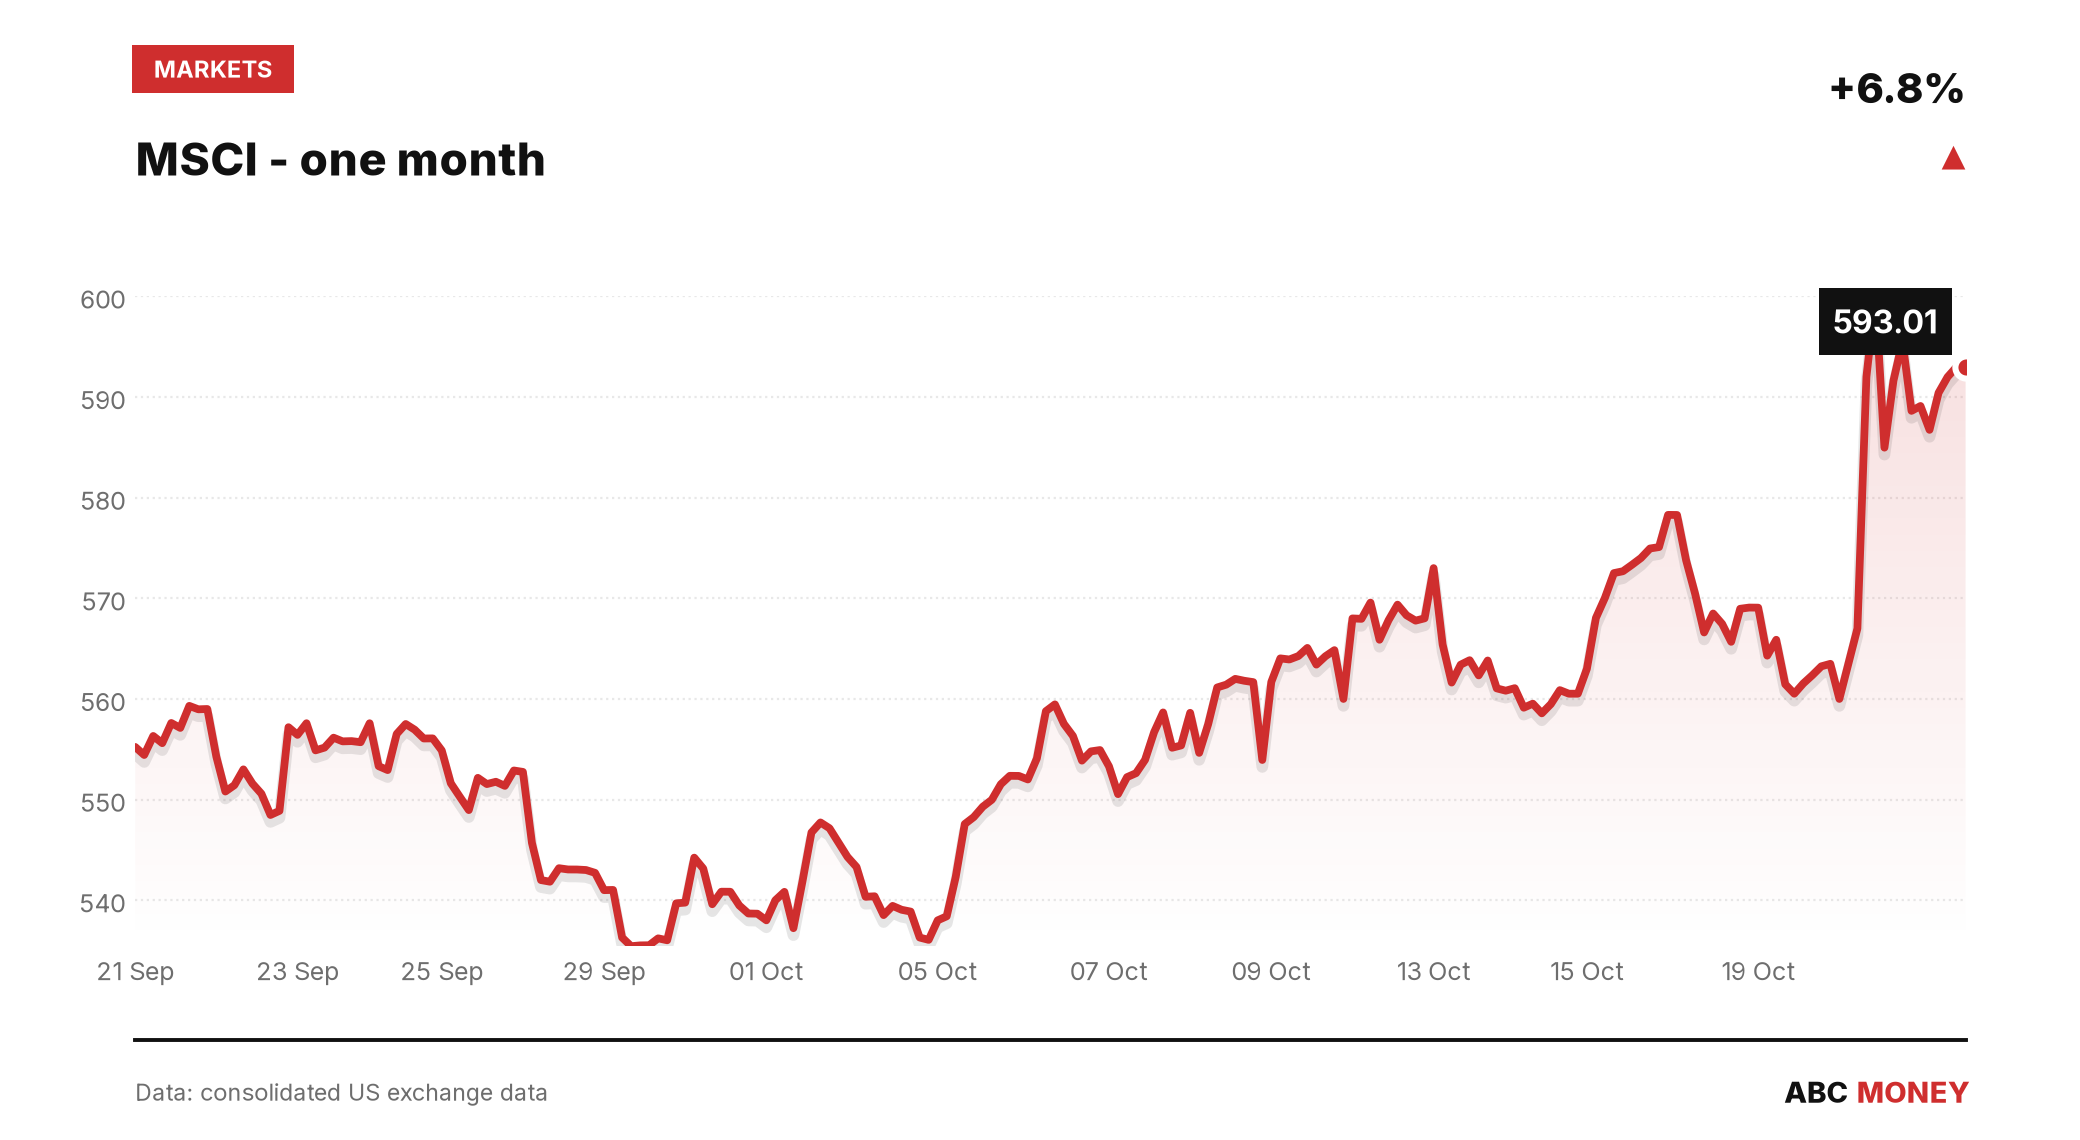
The $627.2m of repurchases – 1,116,460 shares at an average price of $561.81 between 1 July and 19 October – came as the stock traded within sight of a 20-day high of $600 and climbed 8.96% over the preceding 20 trading days to $593.01. Shares had earlier jumped as much as 4.13% to $586.76 in the immediate reaction to the results, as first reported by Investing.com.
That buying is happening against a macro backdrop that matters for a business valued on its subscription-like, recurring-revenue economics. The 10-year US Treasury yield stood at 5.09% as of mid-October, with the 10-year/2-year spread at 0.38 percentage points – a relatively steep curve, per Federal Reserve data, that tends to pressure the multiples investors are willing to pay for long-duration growth stories like MSCI’s, even when the underlying numbers keep clearing the bar.
The next test comes with MSCI’s fourth-quarter results, when investors will get a clean read on whether Index segment momentum and the First Street integration can sustain growth rates without further help from acquisitions agreed in prior quarters.
This article is for information only and is not investment advice or a recommendation to buy or sell any asset. Markets move quickly; figures are correct as sourced at the time of writing. Always do your own research before making financial decisions.