Molson Coors Q3 results: profit up, revenue down, numbers clash
Molson Coors Q3 results show profit swinging to $271.5m, but the filed revenue figure and a widely cited estimate are $470m apart.
In this article 3 sections
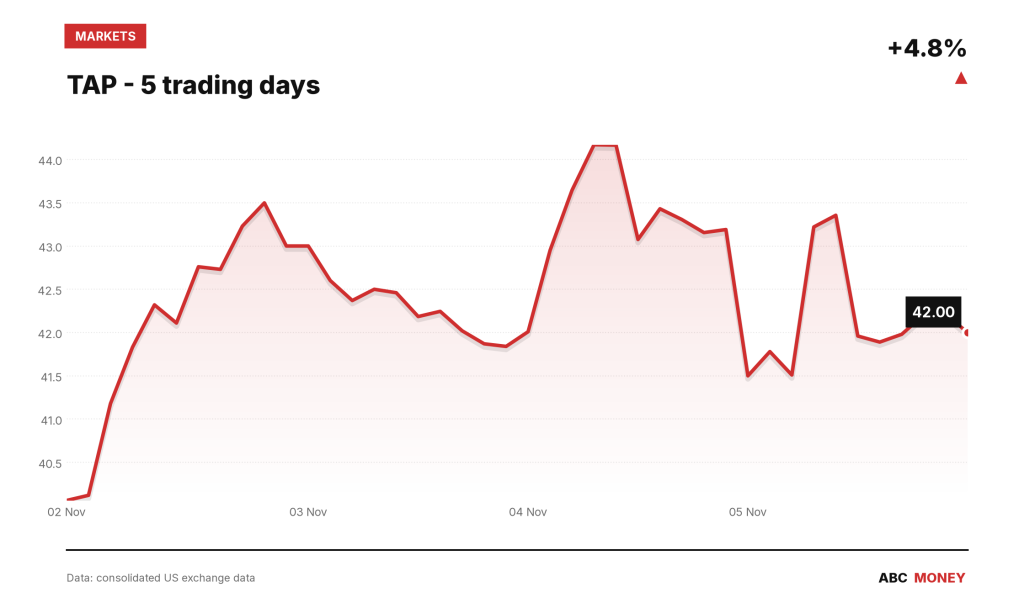
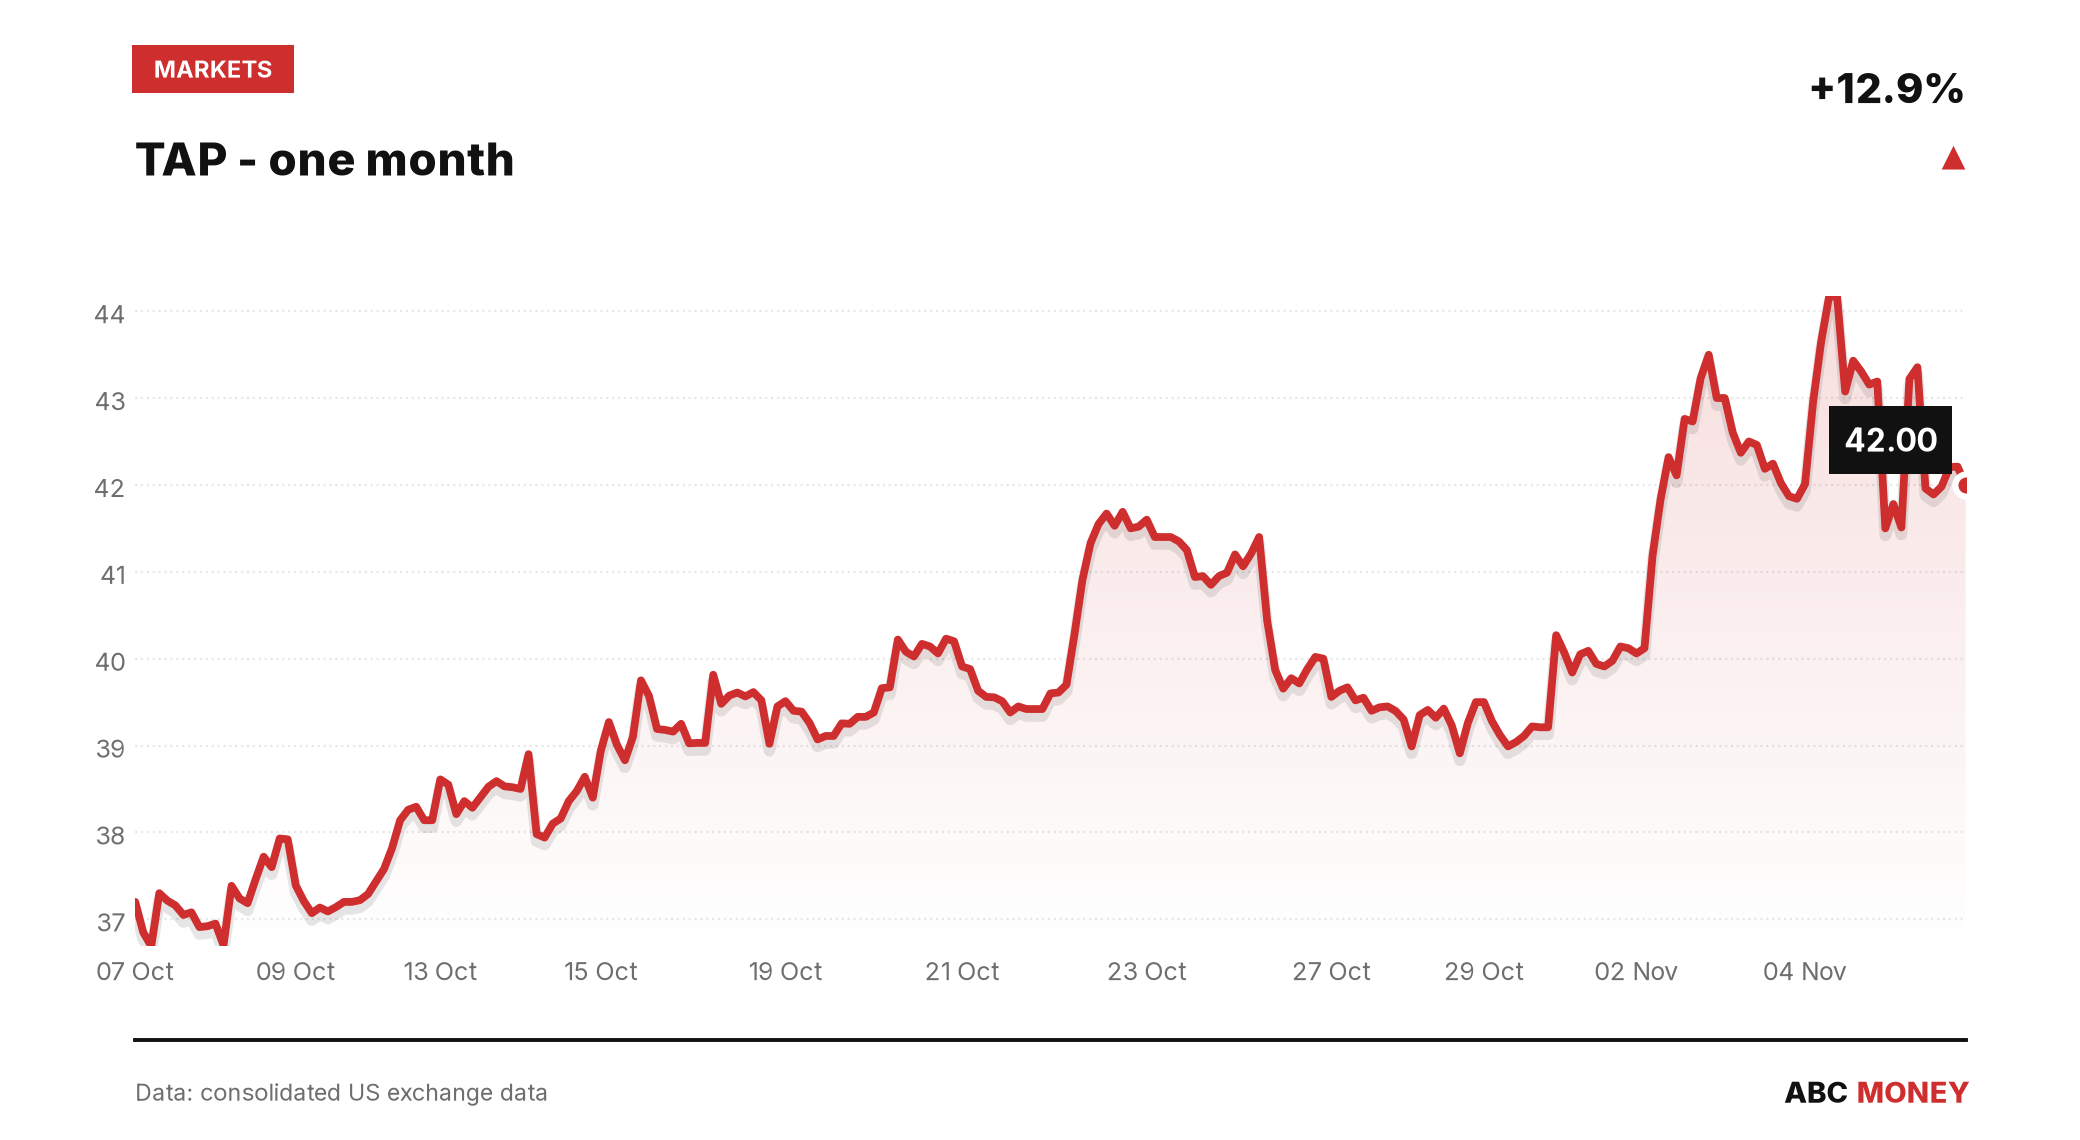
Molson Coors’ Q3 results landed on 5 November with a headline that looked straightforward: net income swinging from a catastrophic loss a year earlier to a $271.5m profit, diluted earnings per share of $1.45. Investors weren’t convinced. Shares in Molson Coors Beverage Company (NYSE: TAP) fell 2.82% on the day, closing at $42.00 on volume 1.85 times the 20-day average, according to the company’s own results statement. That’s an unusual reaction to a profit beat, and the filing explains why.
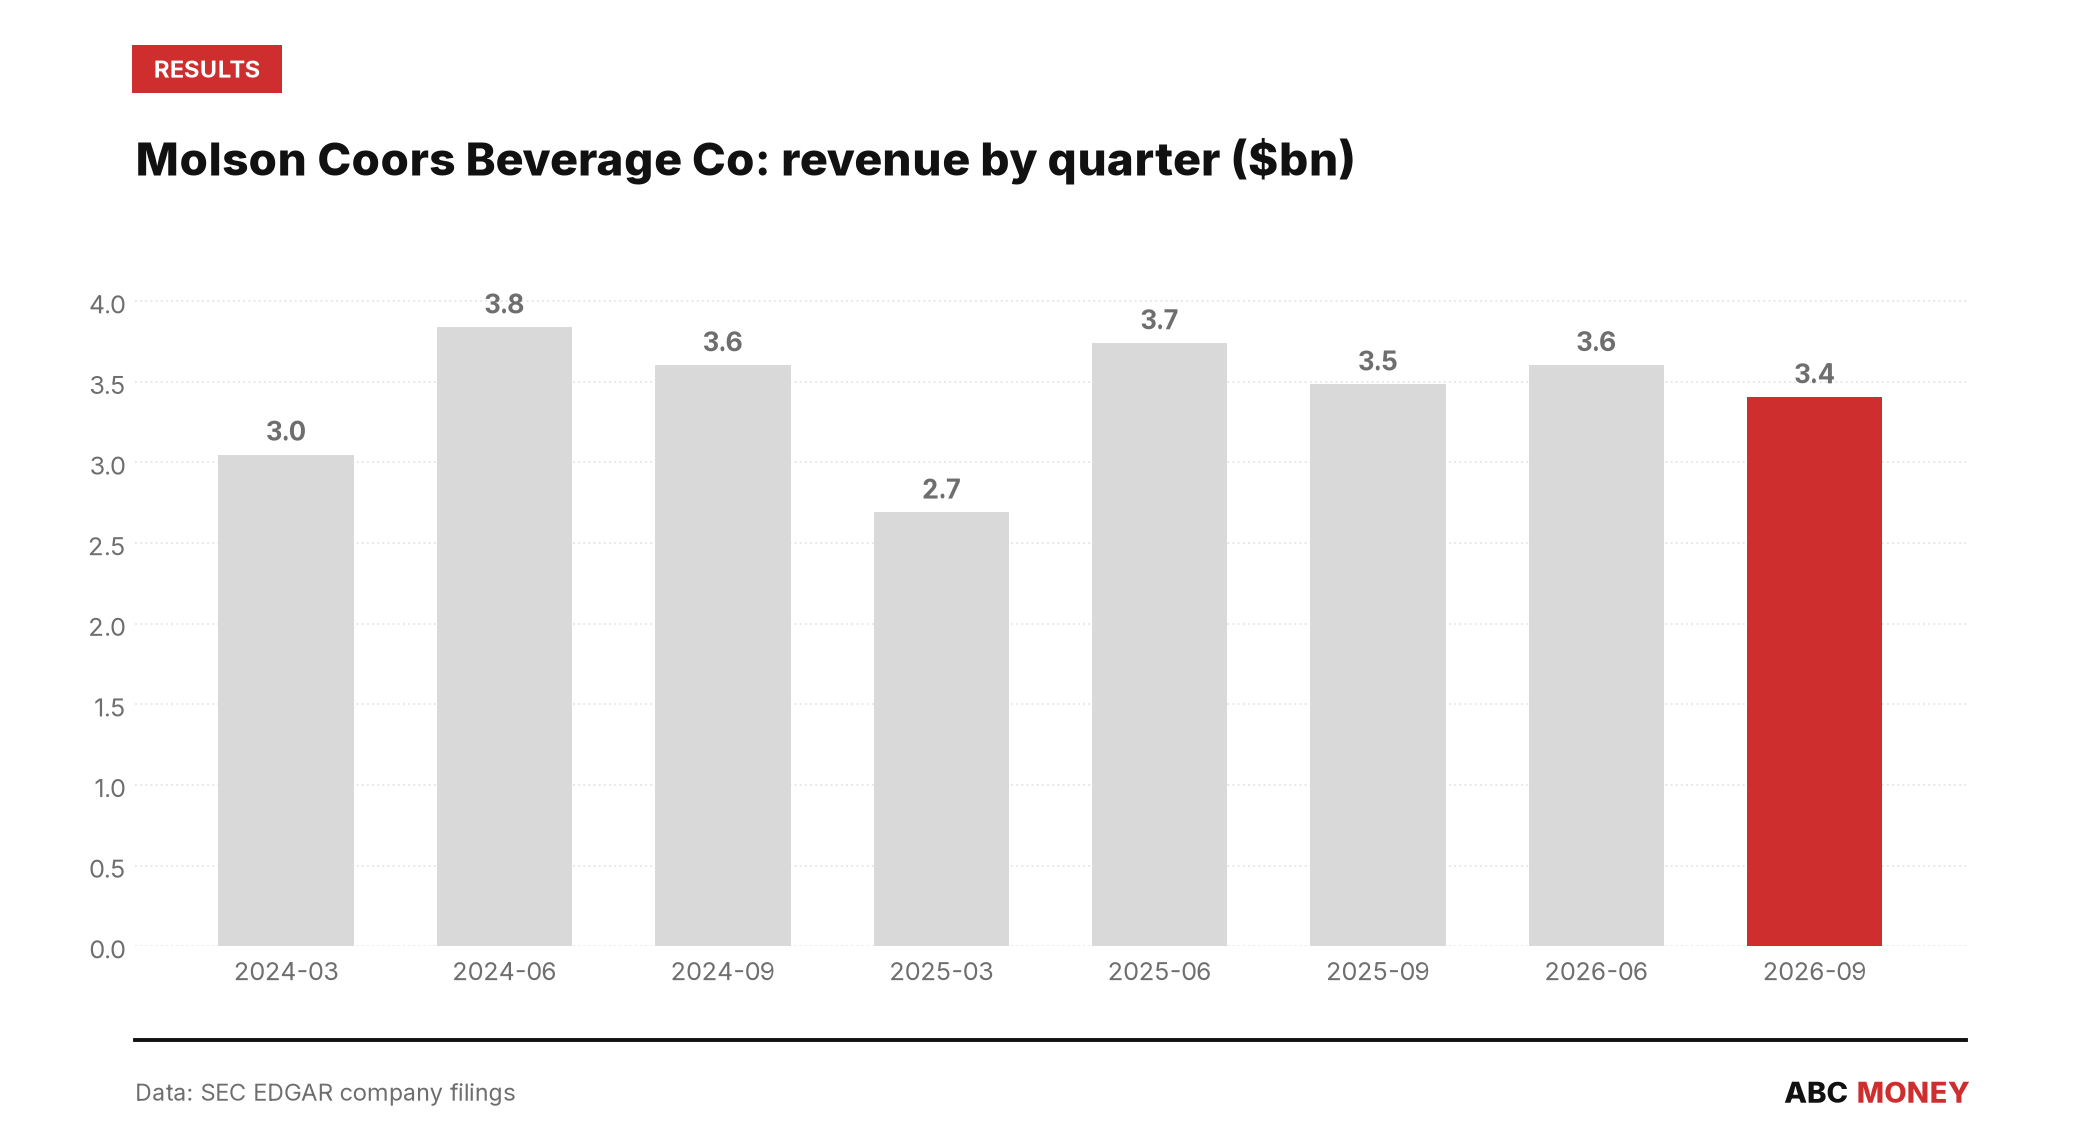
Strip out the headline EPS figure and the quarter looks softer than the top-line story suggests. According to the 10-Q filed with the SEC for the quarter ended 30 September 2026, revenue came in at $3,404.9m – down roughly 2.3% from the $3,484.3m reported in the same quarter of 2025, per the prior-year filing. A brewer whose top line is shrinking year-on-year isn’t the story the EPS jump implies.
The comp that does the heavy lifting
The profit swing is real, but it’s mostly an artefact of what Molson Coors was lapping. Q3 2025 carried a net loss of $2,927.6m – equivalent to diluted EPS of -$14.79 – driven by a one-off impairment charge rather than any operating collapse. Against that base, almost any positive net income looks transformative. This year’s $271.5m profit and $1.45 EPS are genuine numbers, filed and dated 5 November 2026, but they’re being measured against a quarter that was never a clean baseline to begin with. Investors pricing the stock on the EPS delta alone were comparing current trading performance with an accounting write-down, not with underlying demand.
That distinction matters for how the quarter should be read. Revenue is the cleaner yardstick for whether beer, cider and the rest of the portfolio are actually selling, and on that measure the trend points the wrong way. Quarterly revenue has been uneven across the group’s recent filings – $3,740m in Q2 2025, $3,604.4m in Q2 2026, then this quarter’s $3,404.9m – but the year-on-year comparison for Q3 specifically is a decline, not an advance.
A $470m gap nobody has reconciled
Complicating matters further, not every account of the quarter agrees on what the revenue number even was. A separate earnings-flash report put Q3 revenue at roughly $2.93bn against a FactSet estimate, a figure around $470m below the $3,404.9m the company itself filed with the SEC. That’s not a rounding difference – it’s close to 14% of the reported top line, large enough that it cannot simply be explained away as a different revenue definition or segment cut. The gap sits unreconciled: the SEC filing is the primary, legally binding disclosure, and that is the number that should anchor any read of the quarter, but the discrepancy underlines how easily headline comparisons against analyst estimates can diverge from what a company has actually filed.
What the trading tape was saying
The market’s scepticism showed up before the numbers even landed. Short-side trading activity in TAP, tracked through the FINRA daily short-sale volume data, climbed steadily into the print – from a short-sale ratio (the share of daily volume attributable to short sales) of 0.416 on 26 October to 0.738 on 5 November itself, the highest reading in the fortnight running up to results. That build-up, paired with the stock’s retreat from a 20-day high of $44.17 to $42.00 on a heavy-volume day, suggests positioning had already tilted toward doubt about whether the EPS comparison would hold up to scrutiny once the revenue line was examined.
None of this makes the quarter a disaster. A $271.5m profit is a profit, and the company is no longer absorbing the kind of impairment that produced last year’s near-$3bn loss. But the gap between the framing – a recovery story built on an EPS swing – and the filing itself, which shows revenue still contracting year-on-year, is the part of this release that deserves more scrutiny than a single headline number can carry. Management’s commentary on the quarter, delivered on the earnings call the same day, will matter more than the press release once analysts start asking which of this year’s volume and pricing trends management expects to carry into the final quarter of 2026.
For now, the clearest marker is the one in the filing itself: revenue down, profit up on a flattering comparison, and a stock that fell anyway. The next data point worth watching is whether Molson Coors’ full fourth-quarter filing, due early next year, shows the top line stabilising or continuing the slide first visible in this quarter’s numbers.
This article is for information only and is not investment advice or a recommendation to buy or sell any asset. Markets move quickly; figures are correct as sourced at the time of writing. Always do your own research before making financial decisions.