NASDAQ 100 index or the US Tech 100 is the giant stock market indexes featuring in the US stock exchange market. The NASDAQ comprises 100 top and largest non-financial companies highlighted in the NASDAQ stock market. The market accommodates all major industries and companies in the index from:
- Computer hardware and Software telecommunications
- Retail and wholesale trade
- Biotechnology
The companies are both domestic and international and selected based on market capitalization. The technology and communication companies take the biggest share of the NASDAQ market index (80%). Example of companies taking large percentage are:
- Apple Inc. 18.5 %
- Microsoft Corp 8.99%
- Google 5.50%
The three Companies top in the NASDAQ 100 index market. Different economic events influence NASDAQ market prices. There are several factors traders in the stock market consider before venturing into US-Tech 100.
- The strength of the US dollar.
- The company’s profits and growth.
Who can trade in NASDAQ 100 index?
Trading in the NASDAQ 100 index requires substantial knowledge and experience. The market is open to traders, but you need NASDAQ brokers. The brokers must be licensed, experienced to trade on your behalf. The broker intervention in US-Tech 100 comes in handy since the market is complex. It’s challenging to handle the paperwork, learn the market prices fluctuations. Note NASDAQ market price reflects the real-time market details.
The broker can handle transactions, receive and respond to client order without any pressure. They can track the market prices by studying and analyzing the charts. A qualified NASDAQ broker can keep up with the paperwork, trace all company’s assets and get crucial data on leading companies to invest in.
Monitoring and Analyzing the NASDAQ index
The stock exchange market offers several ways of monitoring and analyzing the NASDAQ 100 index.
- Real-time data
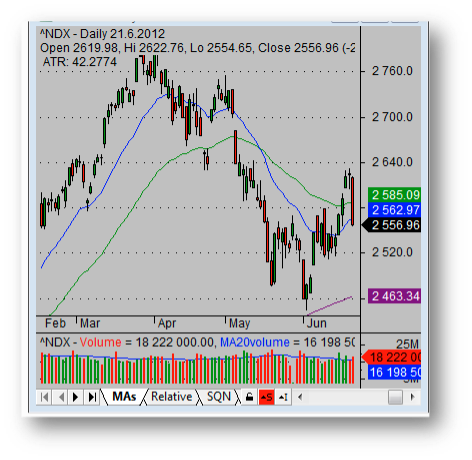
To monitor the market index, one requires real-time data. This is data collected throughout the day. It’s also more relevant when combines with charts analysis.
Example of chart analysis
- Online trading website
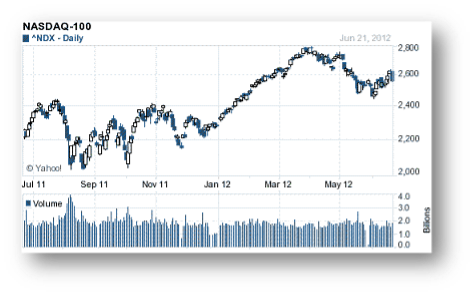
The stock trading industry is vast and offers many trading websites. You can search or monitor the NASDAQ index through free stock markets.
Example
- NASDAQ index funds ETF shares
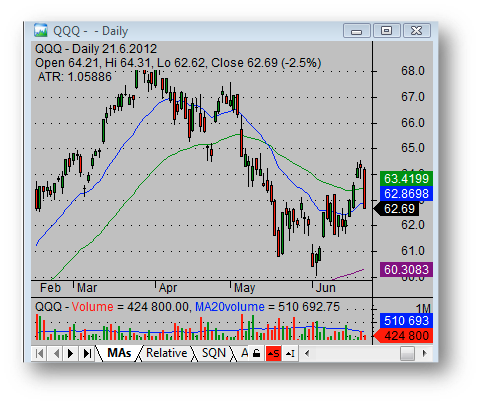
This is also a popular way of monitor and analyzing the market index. The majority of traders use the ETF QQQ (NASDAQ-100 index tracking stock). It’s the oldest and best mode in US stock exchange markets.
Example of QQQ chart
Strategies of analyzing the NASDAQ index stock index
The correct method of analyzing the NASDAQ quotes is working with the trading strategy. The two will provide clear results.
- Always keep the analysis chart simple.
Simple is the only strategy that will help you get the most out of the charts. In simple advice, don’t enter many technical indicators. You can have the major indicators such as moving averages, add volume. The majority of NASDAQ traders use candlestick charts to help in reading the indexes.
- Multiple-time frames
Time frames are only important if used with your trading strategy and system. Traders should have time frames for every analysis. This applies to both traders and investors; however, day traders can use fewer time frames. Other traders such as position traders, swing traders and investors are likely to use a weekly or monthly time frame.
Factors affecting NASDAQ 100 index
Several factors can affect the US-Tech 100 as follows:
- Political events
Politics have a negative and positive impact on the market index. Some events may influence the performance of certain companies in the NASDAQ stock market. For example, suppose the US government closes the business trades with foreign companies. It will greatly affect the market prices for all companies in the stock market. The price is sensitive and can be affected by the economic strength, profits and the trader’s opinions.
- Trader’s sentiments
The trader has the power to change the market value in NASDAQ 100. They can either rise or fall based on the trader view about the market. The act of buying and selling a share of a particular company can change the price since many traders are investing. When the share starts to rise or fall, this also affects the value of the index. This means trader and investors should be keen on every detail in the stock market to avoid loss.


